Analytics Dashboard
Get a comprehensive view of your hiring performance with real-time metrics, trends, and insights to optimize your recruitment process.
Overview
The Analytics Dashboard in Hifinity provides a centralized view of all your hiring metrics. Monitor key performance indicators, track trends over time, and identify areas for improvement in your recruitment process.
Key Metrics
The dashboard displays these essential hiring metrics at a glance:
Applications
Total number of applications received across all jobs, with comparison to previous periods.
Active Applications
Applications currently in progress, excluding hired, rejected, archived, and withdrawn.
Candidates
Number of unique active candidates in your hiring pipeline.
Open Jobs
Count of active job postings currently accepting applications.
Average Score
Mean AI evaluation score across all completed interviews, helping gauge candidate quality.
Time to Hire
Average number of days from application to hire, tracking recruitment efficiency.
Time Period Selection
Filter your analytics by different time periods to analyze trends:
Pro Tip
Use the "This Month" view for regular reporting and "This Quarter" for strategic planning discussions. The comparison indicators show how metrics have changed from the previous period.
Charts and Visualizations
The dashboard includes visual representations of your hiring data:
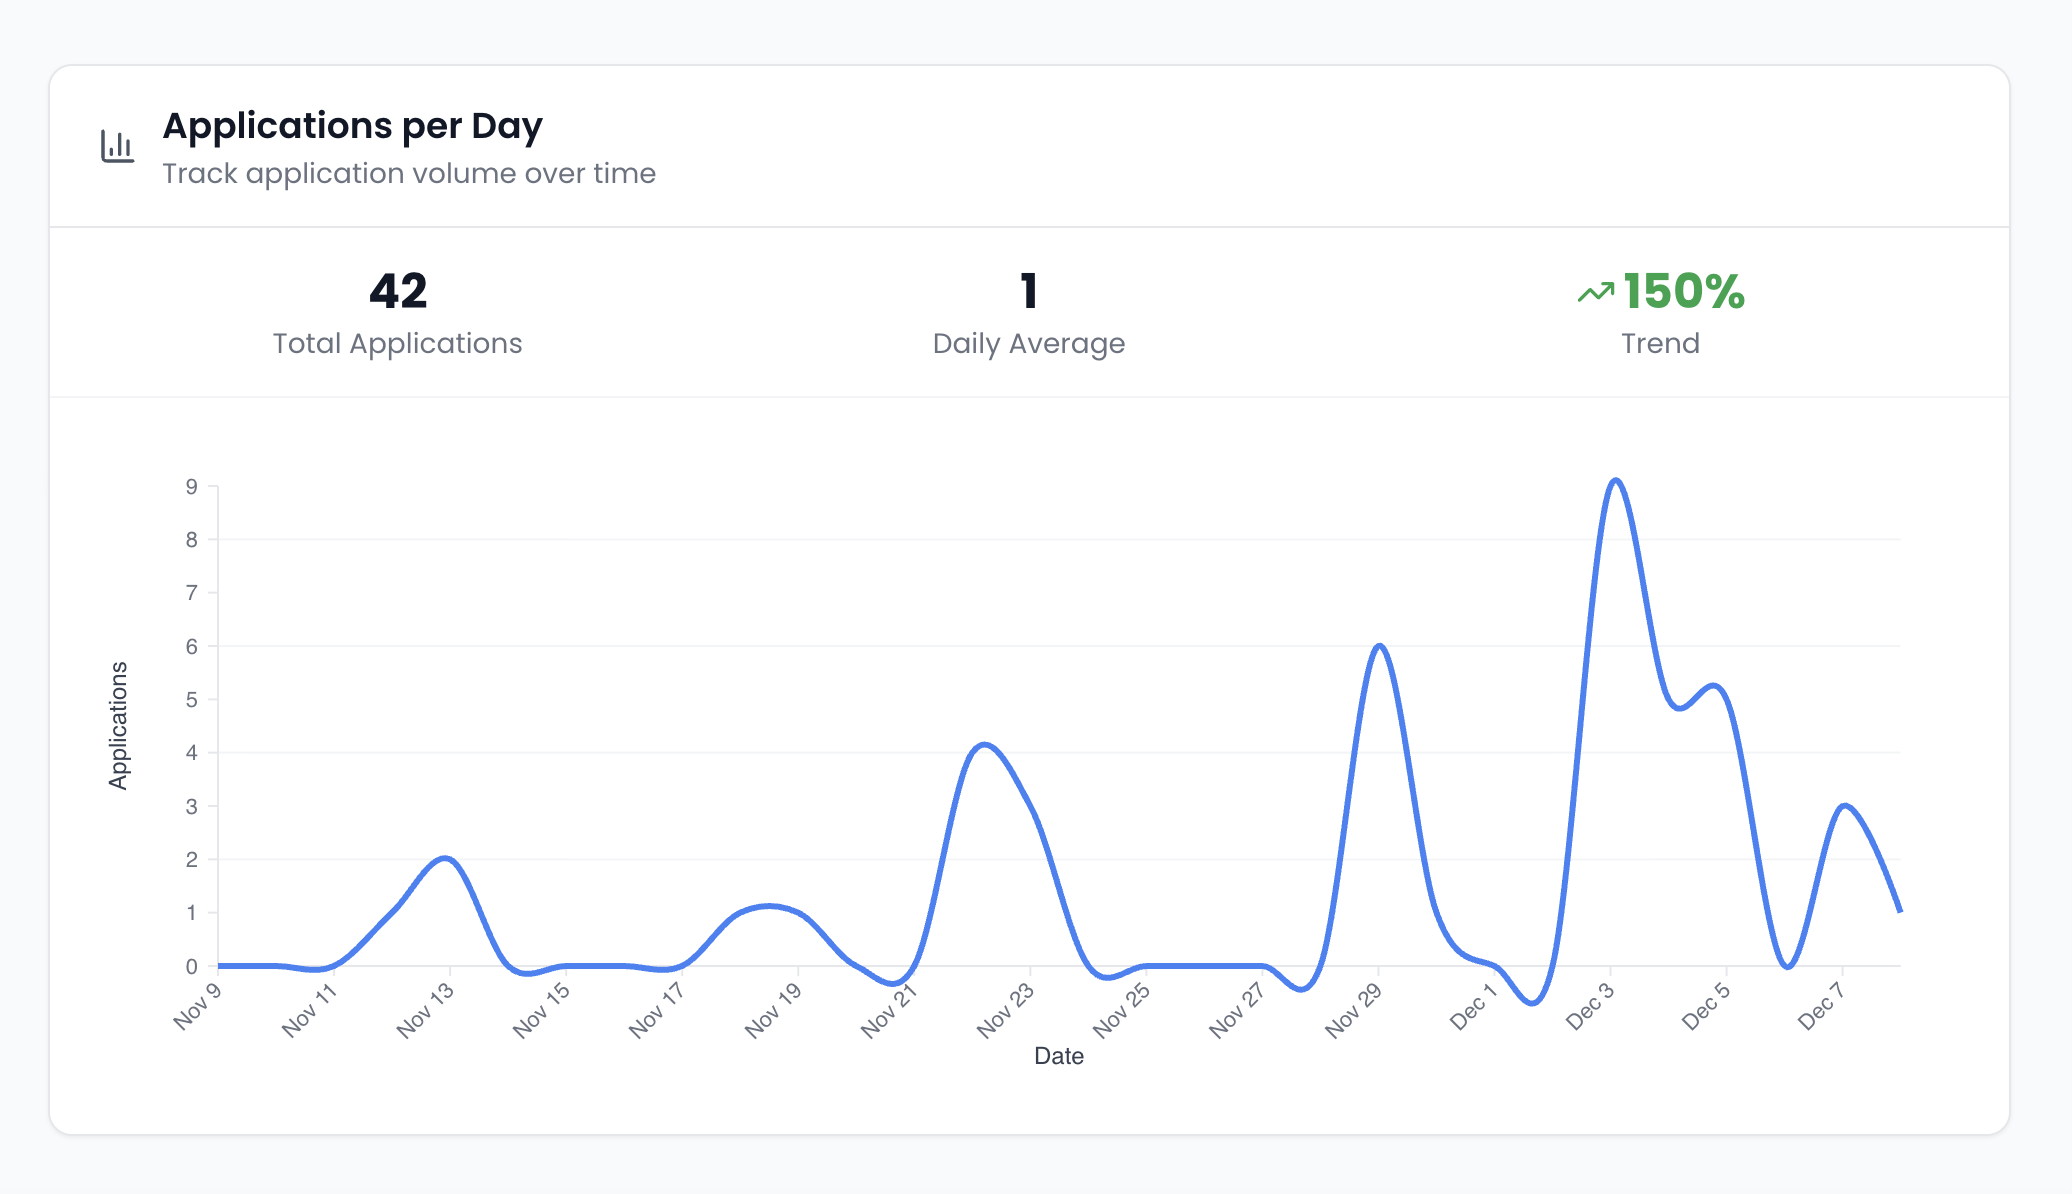
Applications Over Time
Line chart showing application volume trends over your selected time period. Identify peak application times and seasonal patterns.
Pipeline Distribution
Visual breakdown of candidates across different pipeline stages. Quickly see where candidates are concentrated in your process.
Interview Completion Rate
Track how many candidates complete their AI interviews versus those who don't respond or abandon the process.
Recent Activity
The dashboard also shows recent hiring activity:
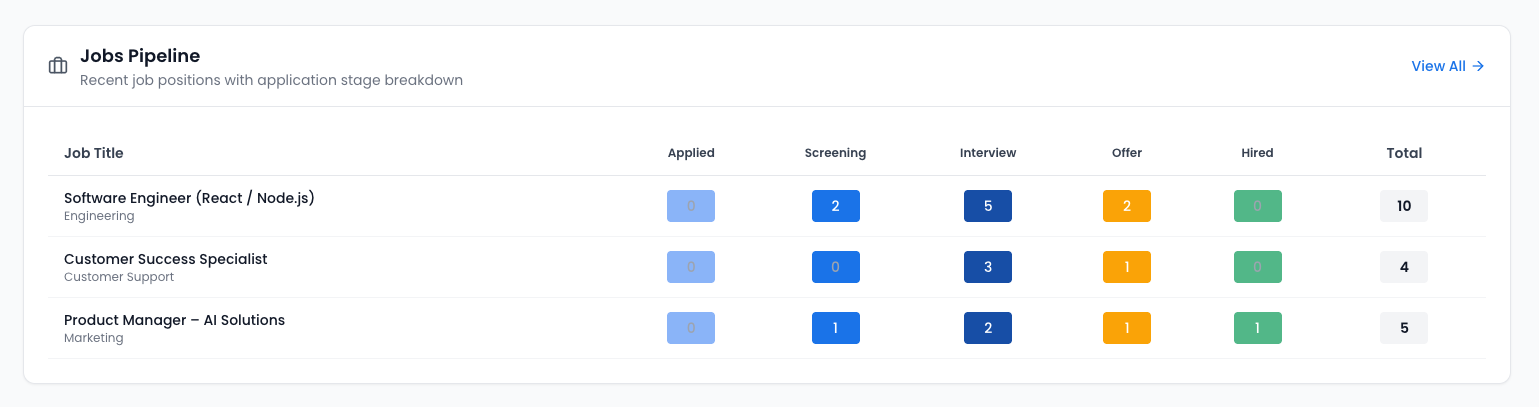
Jobs Pipeline
Recent job positions with application stage breakdown:
Recent Candidates
Newly added candidates in your pipeline: